 Clear
Clear
Search Result

Kansai Nerolac
The Story Till Date
Energy
GRI Standards
| GRI 302: Energy | Sections/Comments | |
|---|---|---|
| GRI 103-1 | Management approach: Explanation of the material topic and its boundary | |
| GRI 103-2 | Management approach: The management approach and its components | |
| GRI 103-3 | Management approach: Evaluation of the management approach | |
| GRI 302-1 | Energy consumption within the organization | Energy Consumption |
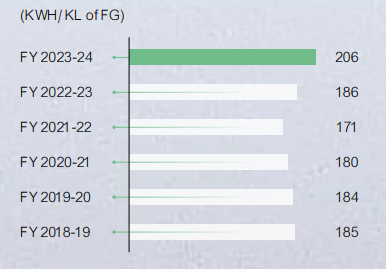
| GRI 302-3 | Energy intensity | Energy Intensity: 1.5 GJ/KL of FG Sp. Power Consumption: Manufacturing Facilities 206 KWH/KL of FG Sp. Fuel Consumption: Manufacturing Facilities 54 LT/MT of Resin |
| GRI 302-4 | Reduction of energy consumption | Sp. Power Consumption: Manufacturing Facilities 206 KWH/KL of FG Sp. Fuel Consumption: Manufacturing Facilities 54 LT/MT of Resin |
| GRI 302-5 | Reductions in energy requirements of products and services | KNPL actively explores and adopts environmentally friendly options, such as renewable energy sources like solar and wind power. By integrating renewable energy into our operations, we decrease our reliance on fossil fuels and contribute to overall decarbonisation efforts. |
Planning for the Future
Going ahead, we have an action plan in place for energy efficiency improvement:
- We plan to have all our plants, Energy Management Systems certified through ISO 50001, an international standard which certifies our commitment towards energy performance and sustainability.
- We aim to gradually adopt new concepts and technologies which will further lead to energy conservation and increased energy efficiency. We have added Solar Power plant of 1250 KW at our Bawal plant and another 570 KW at our Jainpur plant.
- We have also commissioned Wind Turbine 2100 KW capacity at our Hosur plant. In totality we have 6100 KW Wind Turbines installed and commissioned.
- Erection work is in progress for another 2100 KW wind turbine in Gujarat which shall cater to power requirements at our Sayakha plant.
ENERGY CONSUMPTION
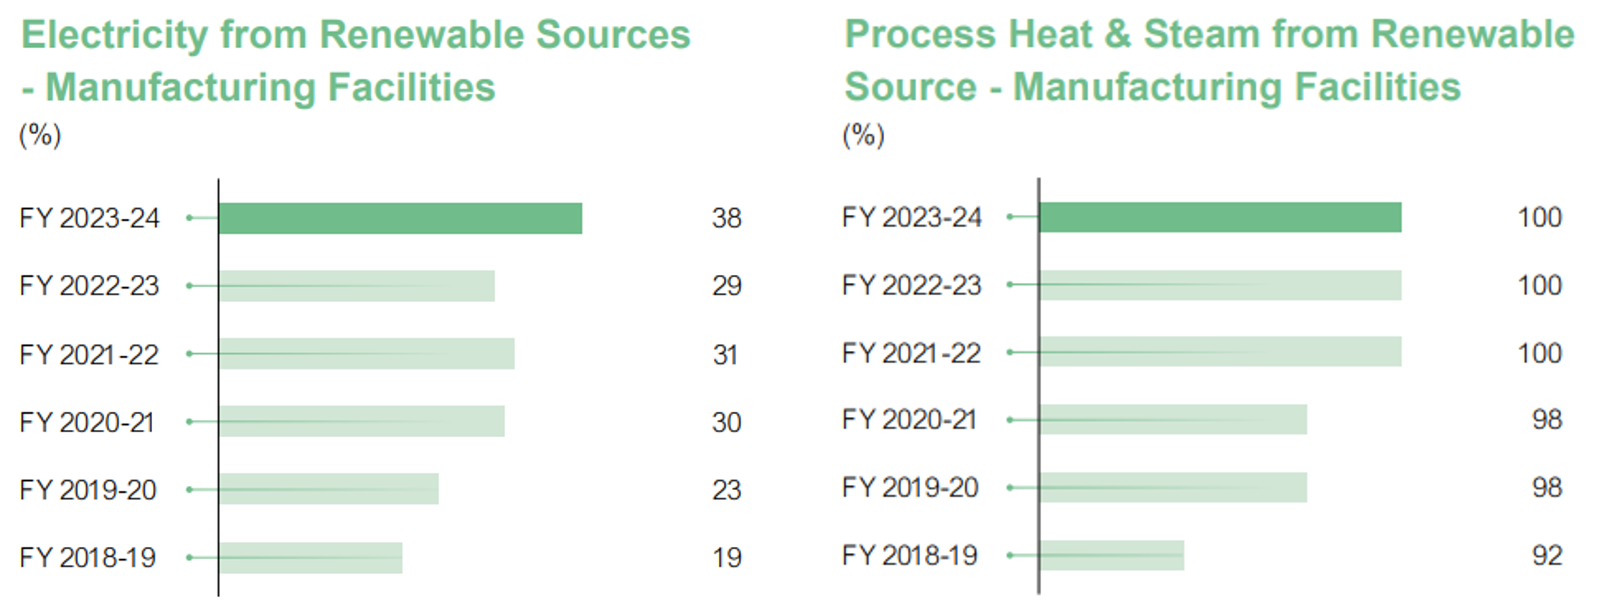
At KNPL, progress in energy management is measured through key indicators of specific power consumption, specific fuel consumption and percentage of renewable energy.
| FY 23-24 | |
|---|---|
| From Renewable Sources | |
| A. Electricity consumption – Renewable Sources | 1,00,502 GJ |
| B. Fuel consumption – Renewable Sources | 31,795 GJ |
| C. Energy consumption through other sources (Biomass / Briquettes) | 1,35,158 GJ |
| Total energy consumed from renewable sources (A+B+C) | 2,67,456 GJ |
| From Non-Renewable sources | |
| D. Electricity consumption – Non-renewable Sources | 1,75,152 GJ |
| E. Fuel consumption – Non-renewable Sources | 99,124 GJ |
| Total energy consumed from Non-Renewable sources (D+E) | 2,74,276 GJ |
Energy is also used in the form of steam and heat in our manufacturing processes. Most of the steam and heat requirements are being met through bio fuel and biomass based solid fuel boiler.
Specific Power Consumption
 |
Method of Calculation:
Specific Power Consumption is ratio of Electricity Consumed (from all sources) at Plants to Total Production of Finished
Goods during Specified Period. Electricity consumption is sum of electricity received from grid (i.e. state electricity board), electricity generated
from DG set and electricity from renewable energy sources at respective manufacturing facilities.
Specific Fuel Consumption
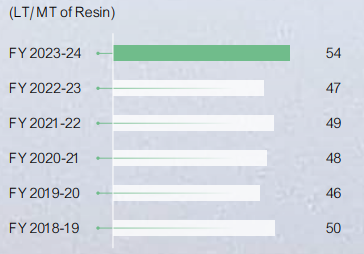 |
METHOD OF CALCULATION- Specific Fuel Consumption is ratio of Fuel Consumption in Boilers at Plants to Total Resin Production during a Specified Period.
Energy Intensity
In FY 2023-24, we consumed 5,41,732 GJ of energy within the organisation while our overall energy intensity was 1.5 GJ/ KL of FG.
Method of Calculation:
Energy Intensity is ratio of Total energy (Fuel + Power + Heat and Steam) consumed within factory premises organisation-wide (Manufacturing facilities, R&D centre and Head Office) to Total Production of Finished Goods during specified period.
Reduction of energy consumption
At KNPL, we measure our energy management progress using key performance indicators (KPIs), such as specific power consumption, specific fuel consumption, capacity addition of green power, percentage of green power utilisation, power factor controls, fuel mapping and adoption of greener alternatives.
Utilised 38% of electricity from renewable sources
Achieved 13% reduction in Scope 1 & 2 emissions from baseline FY 2018-19
Accomplished 3% reduction in Scope 3 intensity from baseline
Planted 7,790 trees
Diversification of Energy-mix
Solar Capacity augmentation
Commissioning of rooftop solar projects at Jainpur and Bawal
Commissioning 5 solar trees, with a total capacity of 65 kW, at Bawal
Captive Wind Power augmentation
Commissioning of 2nd captive wind turbine of 2.1 MW in the state of Tamil Nadu in July 2023.
Renewable Energy:
We constantly search for alternate sources to increase our share of green energy and accordingly plan our initiatives based on feasibility and applicability. This, in turn, allows our facilities to be increasingly self-reliant in their energy needs and thereby reduce the carbon footprint.
In FY23-24, total renewable energy consumed was 2,67,456 GJ, accounting for 49% of our Company’s total energy consumption.
 |
Heat & Steam generation through Biomass based Boiler
| Heat & steam generation through a biomass-based boiler | |
|---|---|
| Total steam consumption | 20,308 MT |
| Total heat consumption | 1,91,833 Lakhs Kcal |
Other Initiatives
• Air Compressor Heat recovery system
• Fibre Re-enforced Plastic Cooling Tower fan blades replacement with Epoxy coated technology.
• Automatic Power Factor Controller controls for ensuring unity power factor
• Intelligent Air flow controllers to ensure Compressors operating at optimal efficiency
• Migration to Piped Natural Gas (PNG) at our plants and usage of Fuel catalyst in PNG
• Replacement of Air Handling Unit (AHU) blower fans with new energy efficient blowers
• Replacement of old motors and chillers with new and energy efficient ones.
• Horizontal deployment of energy management system for real time Energy tracking, better analysis and identify areas of improvement.
• Variable Frequency Drive (VFD) installation on certain Mixers
Energy Management system at Hosur
At KNPL, we measure our energy management progress using key performance indicators (KPIs), such as specific power consumption, specific fuel consumption, capacity addition of green power, percentage of green power utilisation, power factor controls, fuel mapping and adoption of greener alternatives. These metrics help us track and evaluate the advancements made in optimising energy usage and transitioning to more sustainable energy sources. Our facility at Goindwal Sahib has been certified by ISO 50001 and we aim to have all our plants and energy management systems certified through ISO 50001, an international standard that certifies our commitment to energy performance and sustainability.
-
 Get in Touch
 -
Store Locator
-
 Download App
Get in Touch
Looking for something else? Drop your query and we will contact you.
