ECONOMIC PERFORMANCE
GRI Standards
| GRI 201: Economic Performance | Sections/Comments | |
|---|---|---|
| GRI 103-1 | Management approach: Explanation of the material topic and its boundary | Material aspects & scope |
| GRI 103-2 | Management approach: The management approach and its components | |
| GRI 103-3 | Management approach: Evaluation of the management approach | |
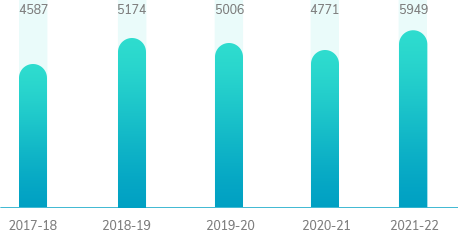
| GRI 201-1 | Direct economic value generated and distributed | Net revenue: ₹ 5,949 crores Profit after Tax: ₹ 374 crores |
| GRI 201-2 | Financial implications and other risks and opportunities due to climate change | Environmental Sustainability risks |
| GRI 201-3 | Defined benefit plan obligations and other retirement plans | Employee Benefits (Note 35, 29) |
| GRI 201-4 | Financial assistance received from government | Company received no financial assistance from government |
Financial Performance

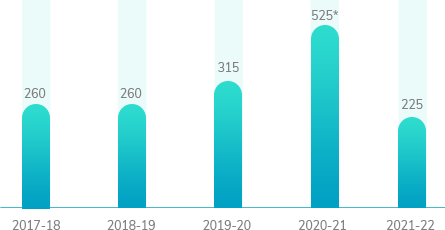
Unprecedented very high inflation was seen in all major categories of raw materials, resulting in substantial increase in material cost. Raw material prices also increased due to global shortages and invoking of force majeure clause by global MNCs. Currency also depreciated during the year which further impacted raw material prices. Gross margins were severely affected mainly in case of industrial business due to high inflation not compensated by corresponding increase in sales price. Operating costs were kept under control by various cost reduction initiatives across all functions. Employee Benefits Expense includes provision made towards retirement benefits to Executive Directors of ` 24.22 Crores for the year. Overheads as a percentage of net revenue were lower at 13.9% compared to 14.2% of previous year. PBDIT for the year was lower at ` 647.34 Crores compared to ` 843.53 Crores reflecting a de-growth by 23.3%. Depreciation for the year was at ` 153.82 Crores, which is slightly higher compared to the previous year. Other income was lower at ` 32.86 Crores as compared to ` 38.85 Crores of the previous year. Exceptional item represents impairment of investment in subsidiary viz. Kansai Paints Lanka (Private) Limited amounting to ` 11.39 Crores (Previous Year: ` 10.82 Crores) after taking into account its past performance, current change in economic and market conditions consequent to the severe detoriation of political and economic condition, currency devaluation and very high inflation. PBT for the year before exceptional item was ` 516.51 Crores as compared to ` 724.89 Crores of the previous year reflecting a de-growth of 28.7% over previous year. PAT is lower at ` 374.33 Crores compared to ` 530.60 Crores reflecting de-growth of 29.5%.
Way Forward

Budgeting and Control The agenda and preparations for the coming fiscal year are set at KNPL at the beginning of the year, and include the development of a complete yearly business plan. A detailed annual budget is prepared by the Management Committee, which includes functional heads, Managing Director, and then approved by the Board of Directors, based on the annual business plan and macro environment, including currency value, raw material costs, and energy costs, among other things. The Company monitors the budget using several IT platforms and has devised multiple system checks to keep it under control. The functional heads and the Management Committee review the budget on a regular basis.
Revenue from Operations (₹ in Crores)
PROFIT (₹ in Crores)
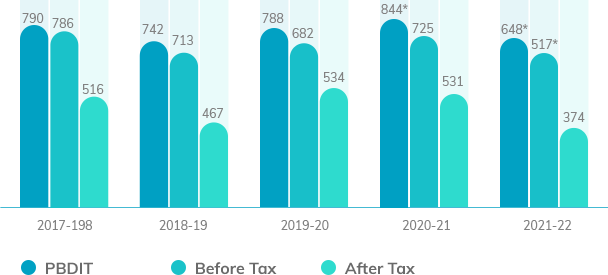
*Before exceptional item (Net of Tax)
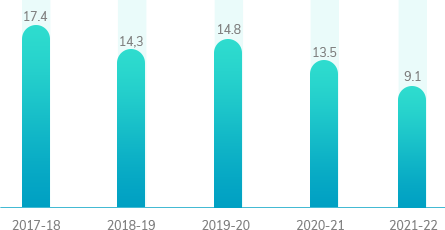
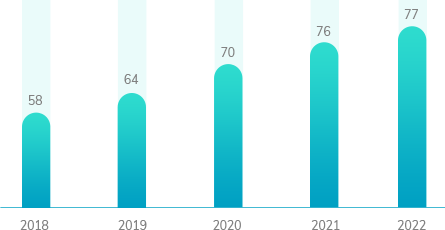
PROFITABILITY (%)
Profitability ratios are based on Net Sales (Net of Excise)
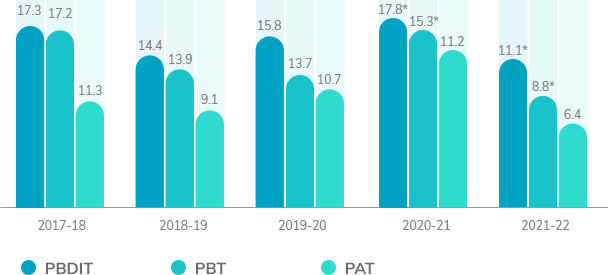
*Before exceptional item (Net of Tax)
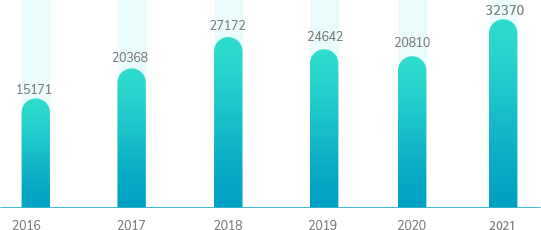
SHAREHODERS’ FUNDS (₹ in Crores)
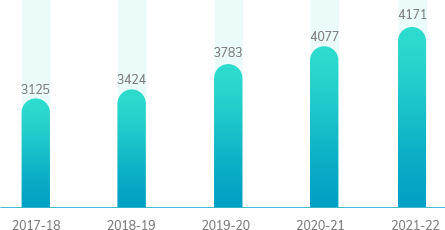
Sales (Net of Excise)
*Before exceptional item (Net of Tax)
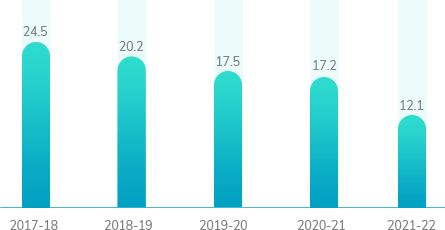
Return on Equity (%)
(Profit after Tax divided by Average Shareholders Equity)
*Before exceptional item (Net of Tax)
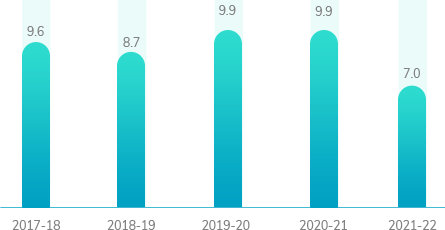
RETURN ON CAPITAL EMPLOYED (%)
*Before exceptional item (Net of Tax)
MARKET CAPITALISATION as on 31st March (₹ in Crores)
EARNINGS PER SHARE (EPS) (₹)
*Before exceptional item (Net of Tax)
EPSfor the years hasbeen calculated consdiering face value of share as `1 each.
DIVIDEND (%)
*Includes speacial dividend of 200%
BOOK VALUE PER SHARE as on 31st March (₹)
Book value of shares for the years has been calculated considering face value of ₹ 1 each.